

For the majority of our customers, an air compressor is like a lawnmower. If they crank it up and it runs, they’re good to go. Sure, many care about energy efficiency, cost and reliability.
But for some companies, it’s a proverbial out-of-sight, out-of-mind scenario. Your air compressor only becomes a topic of conversation when it’s not working right.
Of course, when that happens, and there’s a shutdown, all hell breaks loose. Production stops. Deadlines are missed. You’re paying your people to stand around. Products may be damaged or ruined.
In short, compressor downtime can be a real PITA.
We recognize that most of our customers don’t want to dive into the details of collecting air compressor data, benchmarking it, comparing it to industry norms and tracking it. We get that.
But we have found that at least some attention to data collection can yield tremendous benefits.
The goal of this blog post, then, is to give you some helpful hints about what information to track and capture as a baseline. What to benchmark. And some guidance on what information is important in your operation.
In short, we want you to track information that is critical to your plant. Your process. And apply it to your immediate advantage.
The Benefits of Compressed Air System Benchmarking
Capturing your baseline compressor data and benchmarking it by comparing it to industry norms offers many important benefits. Using the data available readily from your compressor, you can:
- Prevent downtime
- Lower cost
- Save energy
- Lengthen compressor lifespan
- Support compressed air predictive maintenance
- Analyze trends
- Optimize your system
- Justify capital expenditures
- Identify and eliminate leaks and artificial demand (the kinds of “uses” that could be better performed by a broom or a blower)
- Validate warranty claims
- Get back in service more quickly if there is a breakdown
The key to making compressed air system data capturing and benchmarking less of a chore and more of a benefit is picking your key performance indicators, the data points that are most relevant and important to your operation.
How to Pick Your KPIs
Today’s compressors provide so much data that it would be easy to feel overwhelmed. Like drinking from a fire hose. That’s why it’s so important to identify and track those KPIs that provide insight into the operation of your system.
Your first step is establishing what “normal” looks like for your system. This metric is your baseline—the expected performance range under typical operating conditions:
- Run your system under normal conditions for one or two weeks, making sure to capture off hours and weekends and avoiding holidays.
- Capture data across different production scenarios.
- Then analyze that data to establish your baseline performance envelope.
What’s your typical discharge pressure range? What’s your average motor current? What does your load cycle pattern look like?
Once you have that baseline, you can set meaningful benchmarks. These become your measuring sticks. Any significant deviation from baseline tells you something has changed—and in compressed air systems, change usually means an opportunity to optimize or a problem on the horizon.
KPI Goals
The goal in picking your KPIs is to:
- Identify your biggest pain point, then work backward. Is it energy cost? Unplanned downtime? Product quality? Then look for the data that will give you insight into that issue.
- Balance relevance and simplicity. If you and your team don’t know what a specific measurement means, it probably won’t help you.
- Focus on data that is actionable. In other words, what information will enable you to take immediate steps to improve?
- Look for stats that are not just noise but allow you to make meaningful improvements.
To get you started, there are a few stats that might apply to most applications.
General KPIs
Some general data points to track include:
- Pressure. Probably the top-ranked data point to track. And you’ll want to track not only the discharge pressure but the pressure at the end uses. It’s another way to find out whether you have leaks or pressure drops in your system. And keeping the header pressure in your system as low as possible is crucial to energy conservation. Log the pressure set points of the machine if the unit is in the open to make sure no one is messing with the controller without proper knowledge of the impacts.
- kW usage/specific power. Looking at motor current and power draw will give you clear direction on energy consumption. If current is increasing at the same time flow is steady or decreasing, something’s up. And it bears investigation. Specific power indicates how efficiently your compressor is operating.
- Leak rate. Everyone has leaks; it’s a constant battle. And, fortunately, most repairs are inexpensive. So, fixing leaks has the highest return on investment of any improvements you could make in your system.
- Temperature. Regularly monitoring the temperature of an oil-flooded rotary screw compressor can help you catch problems before they escalate, ensuring your system stays reliable and efficient. Ideally, an oil-flooded rotary screw air compressor runs at its sweet spot in the zone of 180°F-200°F.
- Flow rate. While all too many operators boost the pressure at their compressors when users report they don’t have enough air, the problem is usually that the system lacks flow, not pressure. Tracking the flow rate and documenting the amount of air your compressor delivers are critical.
- Air quality. If your dew point and particular levels are high, you are sending water and other impurities to your downstream equipment. That’s a significant problem in some applications, especially food and beverage, electronics, healthcare, and semiconductors.
- Run/load hours. If the run hours (how long your compressor is operating) are more than double the load hours (the time your air compressor is producing air), your compressor is idling too much. Excessive idling could indicate that your system is oversized for your needs, leading to inefficiencies. Water may condense out of the air and cause bearing damage and create rust in the system. You also risk excessive oil carryover.
- Maintenance records. Having records of which service was performed (and when) is a gold mine for a service tech, especially in an emergency.

Industry-Specific Metrics: Some Illustrations
Industry- or application-specific metrics may vary, depending on your process:
- A robotics application needs a stable source of compressed air, so you’ll want to make sure your system remains in a relatively narrow pressure band.
- An automotive painting shop will want to avoid even trace amounts of water in its compressed air. So, you will want to track the dew point.
- An electronics plant will want the air as clean as possible. So, you should track particle size.
- A food or medical plant can’t have any oil mist in the air, so the compressor operator should be watching for oil carryover.
Implementing a Compressed Air System Benchmarking Program
If all this sounds overwhelming, don’t worry. You don’t need to implement a perfect benchmarking program on day one.
Here’s what a quick-wins startup plan might look like:
- Pick your biggest pain point.
- Identify the two or three metrics that will give you insight into that problem.
- Get those measurements flowing in and spend a month or two collecting baseline data.
- Then start looking at what the numbers are telling you.
From there, you can expand gradually. Add more data points. Refine your analysis. Integrate data across different systems in your plant. Before long, you’ve built a compressed air system benchmarking program that’s actually useful.
Make sure you are getting good data. Make sure your flow meters, pressure gauges and temperature sensors are in the right place and calibrated accurately. And decide how you want to monitor that information.
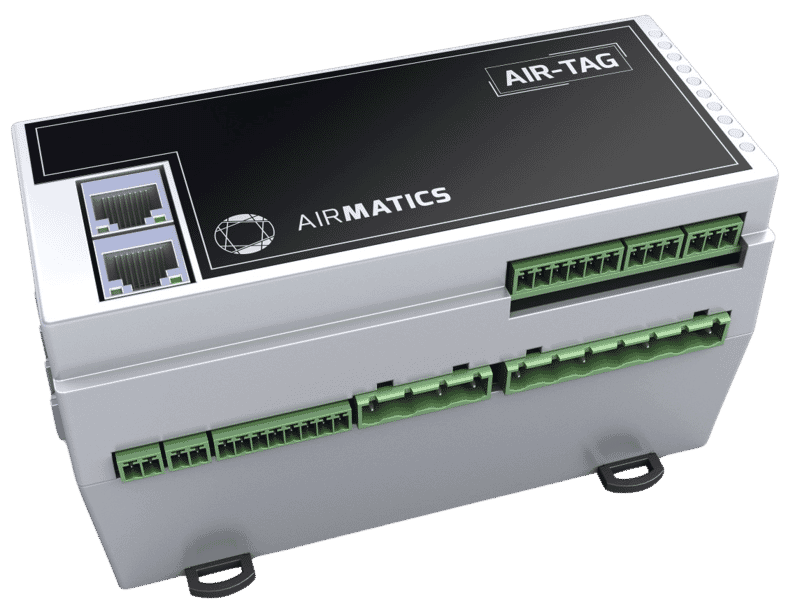
The plants that have done this successfully tell us the same thing: they wish they’d started sooner. The insights are too valuable, the benefits too concrete to wait around.
Getting into Compressed Air System Benchmarking
As you begin to identify KPIs that align with key operations, benchmarking, or at least capturing your baseline data, serves as your introduction to compressed air predictive maintenance across your entire system. Having data to back up your recommendations helps build organizational buy-in.
Ultimately, it transforms how you operate. It moves you from reactive maintenance and guesswork to proactive optimization and confidence-based decision-making.
If you’re ready to build a compressed air system benchmarking program for your operation or want to discuss how your current system is performing, we’re here to help. Your data has a story to tell. Make sure you’re listening.
Key Takeaways
- Most compressed air users don’t want to be diving into the details of collecting air compressor data, benchmarking it, comparing it to industry norms (or even your previous baseline) and tracking it.
- Companies can achieve tremendous benefits by paying attention to data collection, including preventing downtime, lowering costs, saving energy and lengthening compressor lifespan.
- Today’s compressors provide so much data that it would be easy to feel as if you’re drinking from a fire hose. That’s why it’s so important to identify and track KPIs that provide insight into system operation.
- Your goals in establishing KPIs include identifying your biggest pain point and focusing on collecting data that will be actionable.
- Some KPIs, such as pressure and flow rates, power usage, leaks and temperatures, are relevant to most compressed air systems.
- Other KPIs, such as air quality and moisture content, may be more important in sensitive applications.
- Compressed air system benchmarking and baselining your own data can be your introduction to compressed air predictive maintenance across your entire system.
Having solid data to back up your recommendations helps build organizational buy-in.
Get on Track!
Kaishan USA and our nationwide network of independent distributors have worked with plants across many varied industries to implement effective compressed air system benchmarking and optimization programs.
Based in local communities, our distributors can provide on-site help and consultation as needed. They can be absolutely invaluable in helping you select KPIs, collect actionable data, address issues before they become problems and build a benchmarking program that will make top management sit up and take notice.
Find a compressed air professional near you. Or contact us directly.
Further Reading
“Twelve Reasons Why You Should Be Monitoring Air Compressor Data.” Find out all the ways you can use your compressor’s data to save money, optimize performance, lengthen equipment life, enhance safety, improve reliability and reduce or even eliminate downtime.
“Air Compressor Monitoring Tools for a Smart Factory.” A list of the air compressor monitoring techniques available.
“How Well-Designed, Well-Managed Compressed Air Systems Avoid Downtime.” With unplanned downtime now costing the world’s largest manufacturers $1.4 trillion annually, downtime deserves our attention.
“Eliminating Artificial Demand.” The most sophisticated compressed air systems take a hard line on eliminating artificial demand—anything that is not an authorized use.
Frequently Asked Questions
The key is that most plants recoup this investment within the first year through energy savings and reduced unplanned downtime. When you consider that a single unexpected compressor failure can cost $5,000 to $15,000 in lost production and emergency repairs, the benchmarking investment pays for itself quickly.
Start with the essentials—basic pressure, flow and power monitoring—and expand from there as your program matures. You don't need to invest in every bell and whistle on day one.
However, the real insights emerge over time. After three to six months of data collection, you'll start seeing meaningful trends. After a year, you'll have a comprehensive picture of your system's performance across different seasons, production cycles and conditions.
The bottom line: start collecting data now, but patience pays off. The longer your dataset, the more accurate your trend analysis and predictions become.
Legacy systems can absolutely be retrofitted with modern monitoring equipment. You have several options:
- Aftermarket monitoring solutions can be integrated alongside your existing compressor without major modifications. Pressure transducers, temperature sensors and power monitoring devices can be installed at key points in your system to feed data into a centralized monitoring platform.
- Portable data loggers are another option if you want to start small and test the concept before committing to permanent installation. These devices can be moved between different compressors or system points to gather targeted data.
- Motor power analyzers can be clamped onto the electrical leads powering your compressor to measure energy consumption without any permanent installation.
The key is that you don't need a brand-new system to start benchmarking. Even basic monitoring equipment can provide valuable insights into how your current system is performing.
That said, industry reference data can be helpful context. Energy efficiency standards, typical pressure ranges and normal cycle patterns for your industry provide ballpark figures. But your baseline—the actual performance of your system under your operating conditions—is your real measuring stick.
The best approach is to establish your own baseline first, then compare it to industry benchmarks to understand where you stand. If your system is running significantly less efficiently than industry norms, that's a signal to investigate. If you're running better than average, you still have an opportunity to optimize further.
Absolutely. Energy consumption is often the biggest operating cost of a compressed air system and benchmarking data reveals where the waste is hiding.
Common efficiency opportunities that benchmarking uncovers include:
- Pressure optimization: Running at higher pressure than necessary. Reducing discharge pressure by just 2 PSI can cut energy consumption by 1 percent.
- Leak detection: Small compressed air leaks add up quickly. Benchmarking data helps you quantify the loss and prioritize repairs.
- Load pattern analysis: Understanding when and how much your system runs reveals whether your compressor type and capacity are properly matched to your actual demand.
- Equipment degradation: Rising motor current or discharge pressure trends indicate mechanical wear that's driving up energy consumption.
Plants that implement serious benchmarking and optimization programs typically see energy cost reductions of 10 to 25 percent. That translates to real money on your utility bills.
Benchmarking is about establishing baseline performance data and tracking how your system performs against those standards over time. It answers the question: "How is my system supposed to perform, and how is it actually performing?"
Predictive maintenance uses trend data to forecast when a failure is likely to occur so you can schedule maintenance proactively. It answers the question: "When is this component likely to fail?"
Benchmarking is the foundation. Once you have solid baseline and trend data, you can move into compressed air predictive maintenance. You spot that motor current is rising gradually, recognize that this trend historically precedes bearing failures and schedule bearing replacement during a convenient maintenance window instead of having the compressor fail unexpectedly.
In practice, a comprehensive compressed air management program uses benchmarking to enable predictive maintenance. They work together.
You don't need a PhD in statistics, but you do need to understand what your data is telling you.
Most modern monitoring systems come with dashboards and reporting tools that do a lot of the heavy lifting for you. They alert you when metrics exceed normal ranges, highlight trends and make it easy to spot anomalies. You're not manually crunching numbers—the software is doing that.
What you do need is someone on your team who takes ownership of the data. This could be your maintenance manager, plant engineer or a designated operator. That person doesn't need to be a data expert, but they should understand:
- What each metric means
- What "normal" looks like for your system
- How to spot trends and anomalies
- When to escalate concerns or investigate further
Many plants find it helpful to work with a compressed air consultant for the initial setup and training. They help you identify the right metrics, interpret what the data is showing and develop an action plan based on the findings.
Think of it this way: you don't need to be a mechanic to understand that your car's warning light means something needs attention. Similarly, you don't need to be a data scientist to interpret compressed air benchmarking data—you need the right tools and a basic understanding of what the numbers mean.
Listen to the Podcast Version



The Out-of-Sight, Out-of-Mind Trap
Welcome to the show everybody! I'm Jason Reed, here with Lisa Saunders. And Lisa, I want to start today with a comparison that I see on shop floors all the time. For a huge number of plants, an air compressor is treated exactly like a backyard lawnmower. If you yank the cord, it cranks up, and air comes out of the hose, you assume you're good to go.The lawnmower mentality! It is so true, Jason, but it is incredibly dangerous. Because unlike your backyard, when a plant's air compressor fails, the grass doesn't just grow a little longer. Everything stops. Production lines freeze, workers are standing around on your dime, and suddenly you're facing a massive, expensive crisis.
Oh, it is a massive pain in the backside. But the catch is, operators don't want to drown in data sheets and charts. They hear the word "benchmarking" and they immediately think of drinking from a firehose of useless numbers. But baseline benchmarking is actually the only way to escape that constant cycle of putting out fires.
Right, and the secret to not drowning is establishing what "normal" actually looks like for your specific system first. You don't need years of historical data to start. You just need to run your system under typical conditions for one to two weeks.
That one-to-two-week window is key. And you have to make sure you capture the off-hours, the weekends, and different production shifts, while absolutely avoiding holidays when the plant is empty. That gives you your actual baseline performance envelope.
And once you have that two-week snapshot, you finally have a measuring stick. This is where we transition from basic benchmarking to true predictive maintenance. Benchmarking tells you how the system is performing right now compared to your normal, but predictive maintenance uses those trends to tell you exactly when a component is about to fail before it actually blows up your Monday morning.
Exactly. If you show the front office a chart showing a gradual, weird trend line deviate from that two-week baseline, you get instant organizational buy-in for repairs. It turns "I think we have a problem" into "the data shows we need to act now."
Decoupling the Data: Pressure, Leaks, and Temperature
So let's get into the actual, actionable KPIs, because you don't need to track fifty different things to make this work. If you had to pick just one metric to start with, Jason, where are we looking?Pressure, hands down. But specifically, the difference between your discharge pressure at the compressor and the pressure at your actual end-use tools. If you've got a big gap between those two numbers, you are staring at a massive pressure drop or a system riddled with leaks.
And those leaks feed directly into what we call artificial demand, where you're basically paying to compress air just to blow it out of holes in the pipes. I love this stat: reducing your discharge pressure by just 2 PSI can cut your entire system's energy consumption by a full 1 percent.
That 1 percent adds up to thousands of dollars real fast on a mid-sized system. Another massive indicator of system health is temperature. If you want to keep your equipment running smoothly and avoid catastrophic failures, regularly monitoring the temperature of oil-flooded rotary screw air compressors is absolutely critical.
Those rotary screw air compressors have a very specific temperature sweet spot, right?
They do. You want them running right in the zone of 180 degrees to 200 degrees Fahrenheit. If you're running cooler than 180, you risk water condensing out of the air right into the oil, which ruins your bearings. If you're running way hotter than 200, your oil degrades, and you're fast-tracking a total compressor shutdown.
Water in the oil is a silent killer for bearings. So, if someone is listening to this on the shop floor right now, and their system doesn't have fancy built-in telemetry, how do they actually start without feeling overwhelmed?
You design a simple "quick-wins" startup plan. Do not try to track everything at once. Pick your single biggest plant pain point. Is it crazy high energy bills? Is it tools losing pressure at the end of the line? Identify that one issue, pick two or three metrics that directly relate to it, and track just those for a month.
I love that approach. Keep it simple, get your baseline on those few critical points, and build from there. Your data has a story to tell about your efficiency, you just have to start listening to it. That's all the time we have for this quick take. I'm Lisa Saunders.
And I'm Jason Reed. Keep the pressure steady, keep those temperatures in the sweet spot, and we'll catch you on the next episode of The Big Dog Podcast.